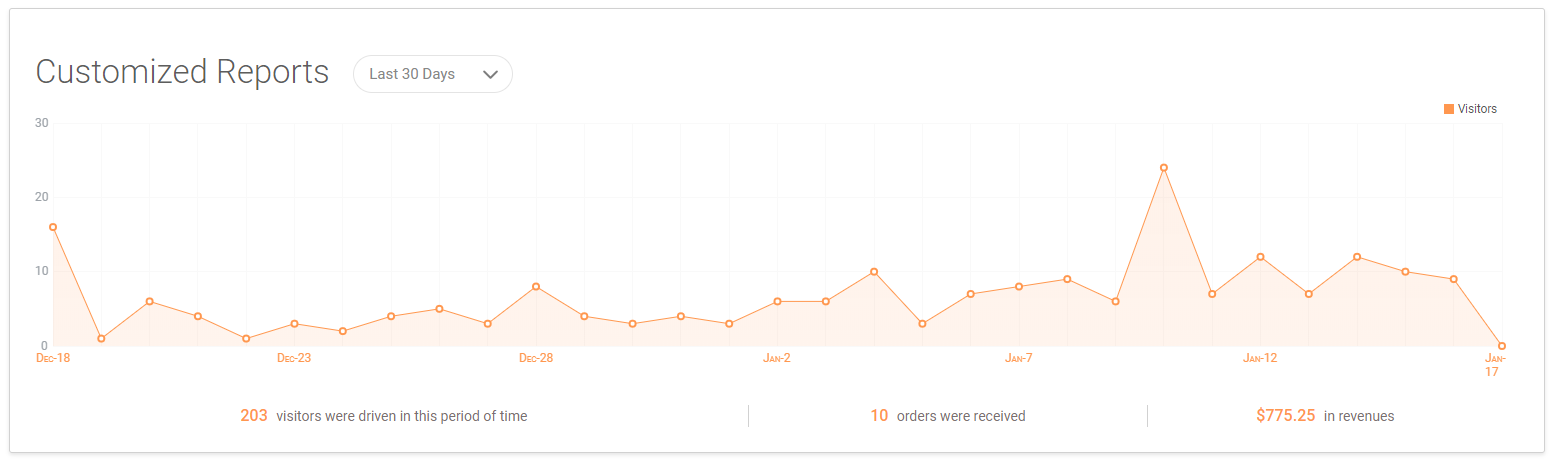
The Customized Report within the Traffic Booster Dashboard is a powerful tool you can use to create your own daily, weekly, monthly, quarterly or yearly reports, or to just monitor you advertising performance.
The following guide shows you how you can easily do this. You will need to be logged into your Traffic Booster App to do the following.
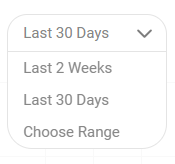
1. Click on the Last 30 Days drop down box
2. Select Choose Range
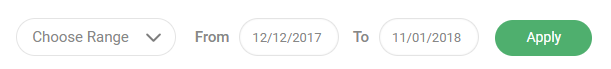
3. Choose the desired range and click Apply
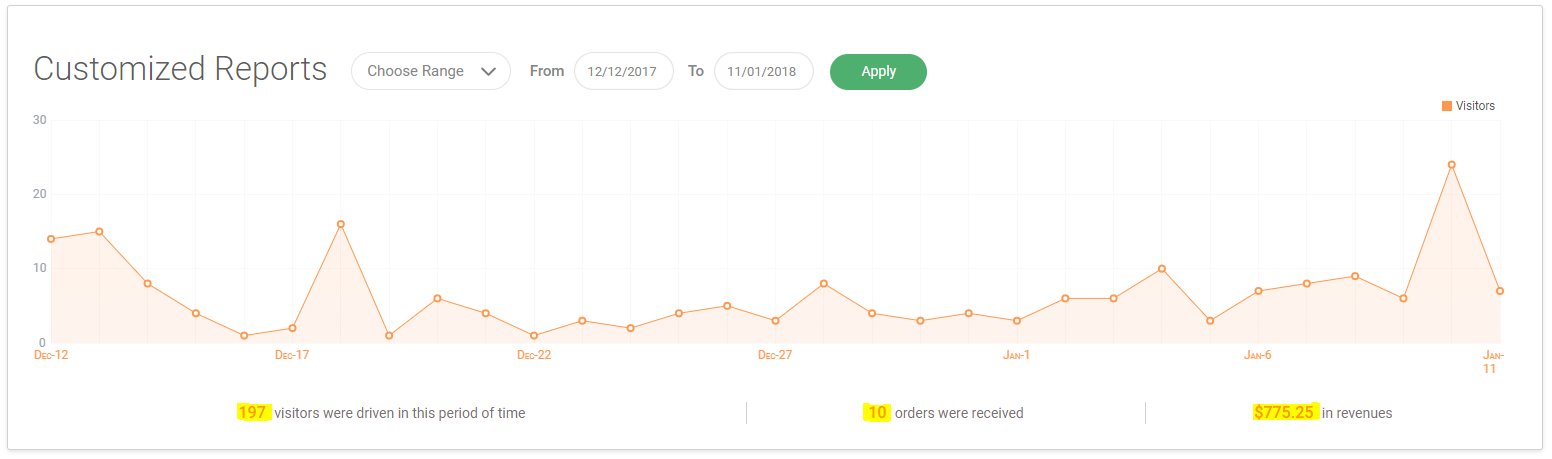
4. View the updated stats for the date range specified beneath the graph
0 Comments